
Use the complete Business Intelligence tool for free
We are offering fully functional license of InfoCaptor Enterprise for zero dollars. That makes us the most affordable and economicalu00a0dashboard applicationu00a0out there. InfoCaptor is available for all platforms Windows, Linux and Mac OS. We ship the package in a starter portable web server and also provide complete instructions to install on your choice of web server (apache, nginx). Here are the details on the download type and how to acquire the free dashboard license.
- Windows Exe: This is recommended for single user analysts type usage. We have packaged everything into a downloadable exe, ready to go. The application still is web based so it needs either Chrome or Firefox to work.
- Windows ZIP: For situations when corporate admin rights policies do not allow exe downloads, you can use this option.
- Custom Install InfoCaptor on Windows using Xampp : Download and Install Xampp for windows and then install InfoCaptor within Xampp
- Custom Install InfoCaptor on Linux using Xampp: Download and Install Xampp for Linux and then install InfoCaptor
- Custom Install InfoCaptor on Mac using Xampp: Download and Install Xampp for Mac and then install InfoCaptor
Once you install InfoCaptor, upon launch it will take you to theu00a0self checkout Free license server. We have made it everythingu00a0frictionlessu00a0as much we could so that you can quickly install and start using. The license generation is also self checkout and there is no sales person to talk to. In fact once you checkout, we give you the license codes right there in the same screen [ yes, no need for providing fake or throwaway email address]
What is included in the Free Business Intelligence application?
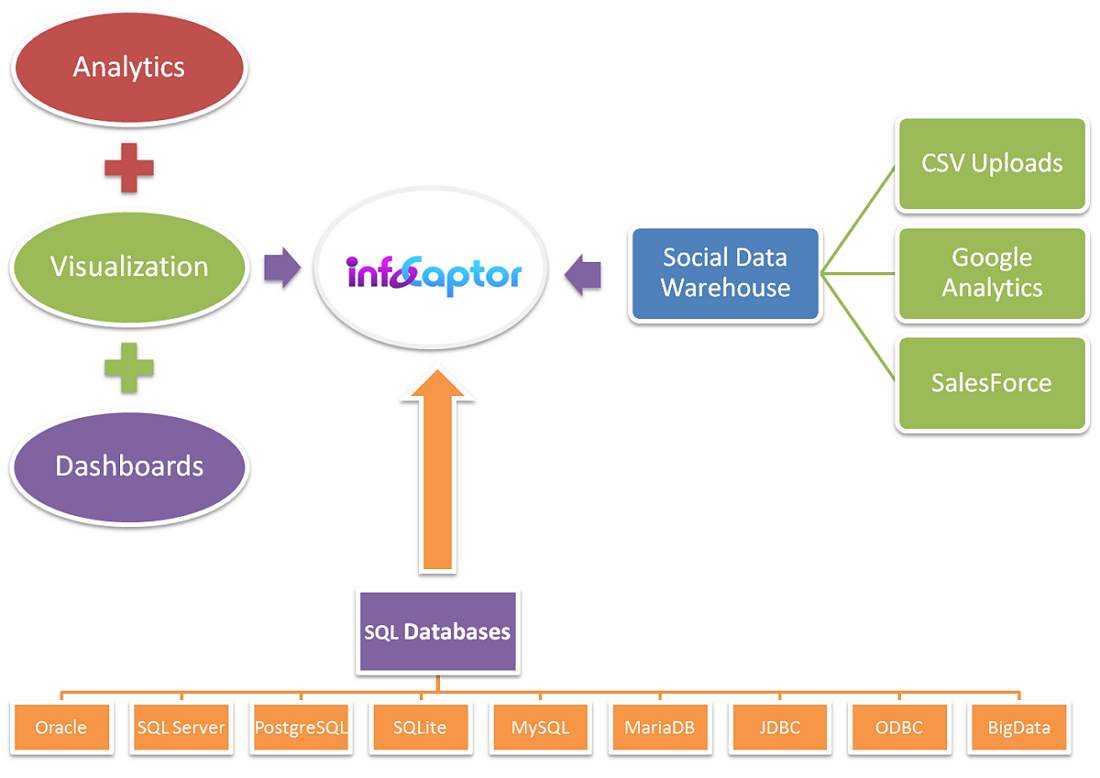
InfoCaptor has grown rapidly in the past few years. Earlier it was just au00a0SQL Dashboardu00a0where you manually typed inu00a0SQL queries to build dashboardsu00a0with all drill downs and chart types. Next we addedu00a0Tableau like Visualizeru00a0where you can drag and drop columns to build analysis andu00a0easily publish to dashboards. Next we added an embeddedu00a0Micro ETL and Data-warehouseu00a0with built-in connectors for Google Analytics and Sales force (more coming soon).
In a nut shell, here is a very high level view of InfoCaptor asu00a0Business Intelligence tool
The complete stack of InfoCaptor makes it extremelyu00a0desirable Analytics and Dashboard application. Our regular pricing for enterprise is extremely affordable and cheap but now with our Free offering it is theu00a0cheapest dashboard tool.
- You getu00a0free Dashboard Designeru00a0to make quick dashboard prototypes
- You getu00a0free ETL to upload CSVu00a0files into MySQL tables
- You getu00a0free Data Visualization Toolu00a0to build adhoc DataViz and publish them into static HTML or interactive dashboards
- You getu00a0free connectorsu00a0to all databases that support JDBC/ ODBC [including Cloudera Impala, Microsoft Excel, Microsoft Access]
- You getu00a0free Social Media Analyticsu00a0with connectors for Google Analytics
- You getu00a0free Salesforce data warehouseu00a0connector, bring all your salesforce data into MySQL tables
Who can use the Free Dashboard Software
For now we have decided to offer free license to the following groups
- Startups and Small businessesu00a0: We understand startups and small businesses and for majority of the small businesses there is not enough time or money to invest in a decent analytics oru00a0reporting software. We want to enable the small business community with the hope they could grow their business faster with added automation of metrics reporting. So for now, we don’t expect anything in return from startups but when you grow profitable or get that big fat funding we hope you would upgrade to paid license.
- Non profit organization: We want to help non-profits everywhere in the world. We don’t want to expect anything in return. Just use our software and checkout as many free licenses as needed.
- Students: We want to enable and help students during their study and use the BI Tools without any restrictions. We hope that once you graduate and get into corporate world we would get your vote in.
Is this a community edition?
This is not a community edition or some kind of restricted software. It is the same version of InfoCaptor Enterprise edition that we hosted for ouru00a0online dashboard serviceu00a0and it is the same edition you get if you had paid for. The difference is that we are simple giving awayu00a0free bi tools licensesu00a0to the aboveu00a0select groups (Startups, Non Profits and Students).
How can you replace Excel Dashboards?
It is futile fighting Excel for basic reporting and pivot tables. For single user system it is a practical approach. In principle, we don’t like the idea of data and presentation sitting in the same excel file so as you grow your reporting requirements to interacting and distributing to more than one person, we recommend to switch to a flexible andu00a0easy dashboard solution. You can still keep all your data in Excel but report and dashboard in au00a0web based reporting solution. InfoCaptor providesu00a0pivot tableu00a0mechanism that users of Excel will find it very handy and convenient. So effectively it is still Excel based dash boarding but you are keeping your data and presentation separate.
How can you do dashboard reporting with Big data/ Hadoop?
InfoCaptor supports JDBC connections to Cloudera Impala, Hive Database and Mapr Drill db. You could install InfoCaptor on one of the Hadoop edge node and integrate using the connectors.
Can I use this as reporting tool for Microsoft Access?
Yes, you can connect using ODBC tou00a0Microsoft Access .mdb file or .accdbu00a0file. The only requirement is that it works only on Windows.
How many CSV or Excel files can be uploaded and converted as MySQL tables?
There is no limit. You can upload and convert as many CSV files as needed.
How is this dashboard app useful for Startups and small businesses?
Startups and Small biz owners already use something like QuickBooks and there are already dashboards packaged within QuickBooks and such accounting systems.
The question should be “How much capacity and time do you have to track?”, Do you think QuickBooks and other systems you are using provide all theu00a0needed metrics for you to grow? Is there anything else you could be tracking tou00a0speed your growth engine? How much time is wasted logging in and out of systems to track different metrics?
For startups and small businesses,u00a0optimization and automation is the key. Optimization provides Agility so that you can produce more with less. Startups are always time-crunched so measuring and monitoring is always pushed back. We have seen that if your startup isu00a0less than 5 people then you probably don’t need dashboard or analytics. The time investment would be hard to justify over other priorities. In that case you could use ouru00a0online data visualization .
Is our data exposed when we use this dashboard app on our server?
No. All data reside on your own servers. We do not have access to it.
Can we use this a reporting tool to combine data from different databases or data sources?
You can build a dashboard and each analysis can be sourced by data from different database.
Can we combine two tables for analysis?
Yes, you need to know how to join the two tables using SQL and then copy the SQL into the Data source. The next step will present you combined columns from both tables and you continue as if it were one table.
Can a person with no SQL knowledge build analysis and dashboards?
Absolutely yes! There are many recipes for building dashboards within InfoCaptor. Unlike Tableau, InfoCaptor works directly with the database. One recipe would be to use SQL queries and build the analysis yourself. Another recipe would be to point at the table, use the data Visualizer, drag drop dimensions and metrics, pick your chart type and be done. If you like the analysis simply push the button to publish into online dashboards. So a person with no SQL knowledge can easily work with InfoCaptor tou00a0produce simple and beautiful dashboards. Theu00a0data Visualizer generates the necessary SQLu00a0in the back end.
How is this comparable to Tableau Dashboards?
At a high level we sayu00a0InfoCaptor provides 70% of the functionalityu00a0that you would find in established BI tools like Tableau, Qlikview etc. If you can show us au00a0Tableau dashboard, you can build similar or better dashboard within InfoCaptor. InfoCaptor started as au00a0dashboard only applicationu00a0so it does provide dynamic parameters, drill downs and so many HTML5 widgets. It was built on top of a wireframing and mockup engine. On the data-visualization front, it incorporates d3js charting library and provides a consistent behavior across all visualizations. InfoCaptor lacks the Geo visualization within the Visualization Editor but it provides the Geo vector maps within the dashboard editor.
What are the different use cases for InfoCaptor?
Remember, InfoCaptor is a comprehensiveu00a0BI applicationu00a0that includesu00a0Dashboards + Visualization + Analytics + Data Warehouseu00a0so this would get quite lengthy.
Use SQL Dashboards: With the growing role of Data Science, Analysts and Data Scientists come equipped with the knowledge of SQL for data analysis. InfoCaptor provides bare metal framework just for that. Plug your SQL queries and present them into any widget. Link different widgets for drill down purpose.
Use Pivot Tables for operational reportingu00a0: InfoCaptor visualization is very advanced and works on the same principle of pivot tables. This provides consistent behavior across all visualization types. One of the fundamental viz type is pivot table. What makes pivot tables different from Tableau is it provides sub-totals and grand totals. In the dashboard editor there are other widgets such as html grid that can do any custom presentation you may require. Like calling stored procedures from MySQL, SQL server, Oracle etc.
Use Google Analytics connector: You can start collecting your website traffic data into your mysql db and then merge it with finance data from other systems to create better co-relation of data. You can check our ownu00a0live Google Traffic dashboard
Use as Personal Dashboard: Export your Fitbit or smartwatch data into CSV and hook it up with InfoCaptor. You can upload CSV to MySQL or just perform a onetime analysis using the data Visualizer.
Use as Social Media Dashboard: We provide the Google Analytics connector and you could use InfoCaptor as a dashboard framework to bring in data from other social media into MySQL tables. We will be adding more social connectors in the future but in the mean time you could use other open source python or php based connectors to bring data from other platforms.